
Viral TikTok Song Case Study: How SAINT KID's "Best Side" Broke After 688 Posts
SAINT KID posted the same song on his own TikTok profile 688 times. For months the videos stayed at a few hundred views each. Then "Best Side" broke. Here is what the numbers show.
Key takeaways
- According to music marketer Channing Mitzell's count, SAINT KID posted "Best Side" 688 times on one profile, starting in mid-July 2026.
- From July to early October, his posts averaged between 204 and 3,231 views per post each week, while he posted up to 109 times a week.
- In the week of November 2, the average rose to 429,256 views per post.
- The two most viewed videos of the breakout weeks were his own: 7.2 million and 2.1 million views.
- His TikTok and Instagram followers grew in the same weeks, and the song entered Spotify and Shazam charts in Norway, France and Sweden.
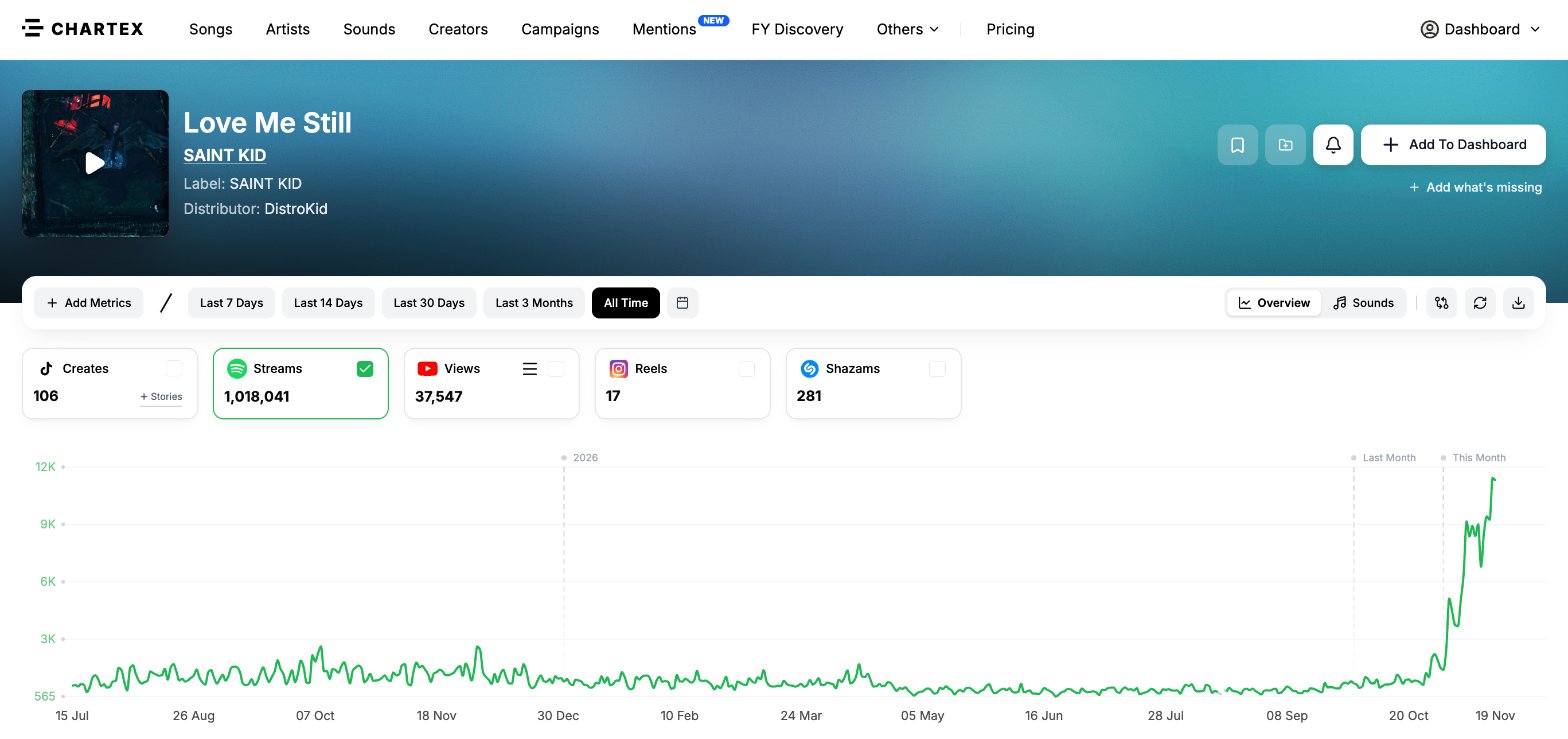
- His older song "Love Me Still", with no TikTok moment of its own, went from under 3,000 to about 11,000 Spotify streams a day.
The story
Channing Mitzell, who makes music marketing videos on TikTok, found "Best Side" on his For You page and scrolled back through the artist's profile. He expected a few polished posts. Instead he found hundreds of videos with the same song, most of them under 500 views. He counted them week by week and shared the result in a video: 688 posts of one song on a single profile.
The posting curve
Each row is one week: how many times SAINT KID posted the song and the average views those posts got.
| Week of (2026) | Posts | Average views |
|---|---|---|
| Jul 13 | 26 | 204 |
| Jul 20 | 10 | 237 |
| Jul 27 | 4 | 389 |
| Aug 3 | 15 | 858 |
| Aug 10 | 26 | 558 |
| Aug 17 | 27 | 307 |
| Aug 24 | 9 | 412 |
| Aug 31 | 4 | 2,586 |
| Sep 7 | 20 | 1,117 |
| Sep 14 | 47 | 1,998 |
| Sep 21 | 91 | 1,023 |
| Sep 28 | 109 | 3,231 |
| Oct 5 | 82 | 1,704 |
| Oct 12 (release) | 103 | 4,746 |
| Oct 19 | 26 | 11,640 |
| Oct 26 | 24 | 81,254 |
| Nov 2 | not shown | 429,256 |
| Nov 9 | 25 | 110,629 |
| Nov 16 (partial week) | 15 | 51,560 |
Source: Channing Mitzell's count of SAINT KID's TikTok profile, as shown in his video. The post count for the week of November 2 is not visible in the video.
For thirteen weeks the average stayed under 3,300 views. The song came out on October 12, in a week with 103 posts. Three weeks later, the average was 90 times higher than in release week.
The song on Chartex
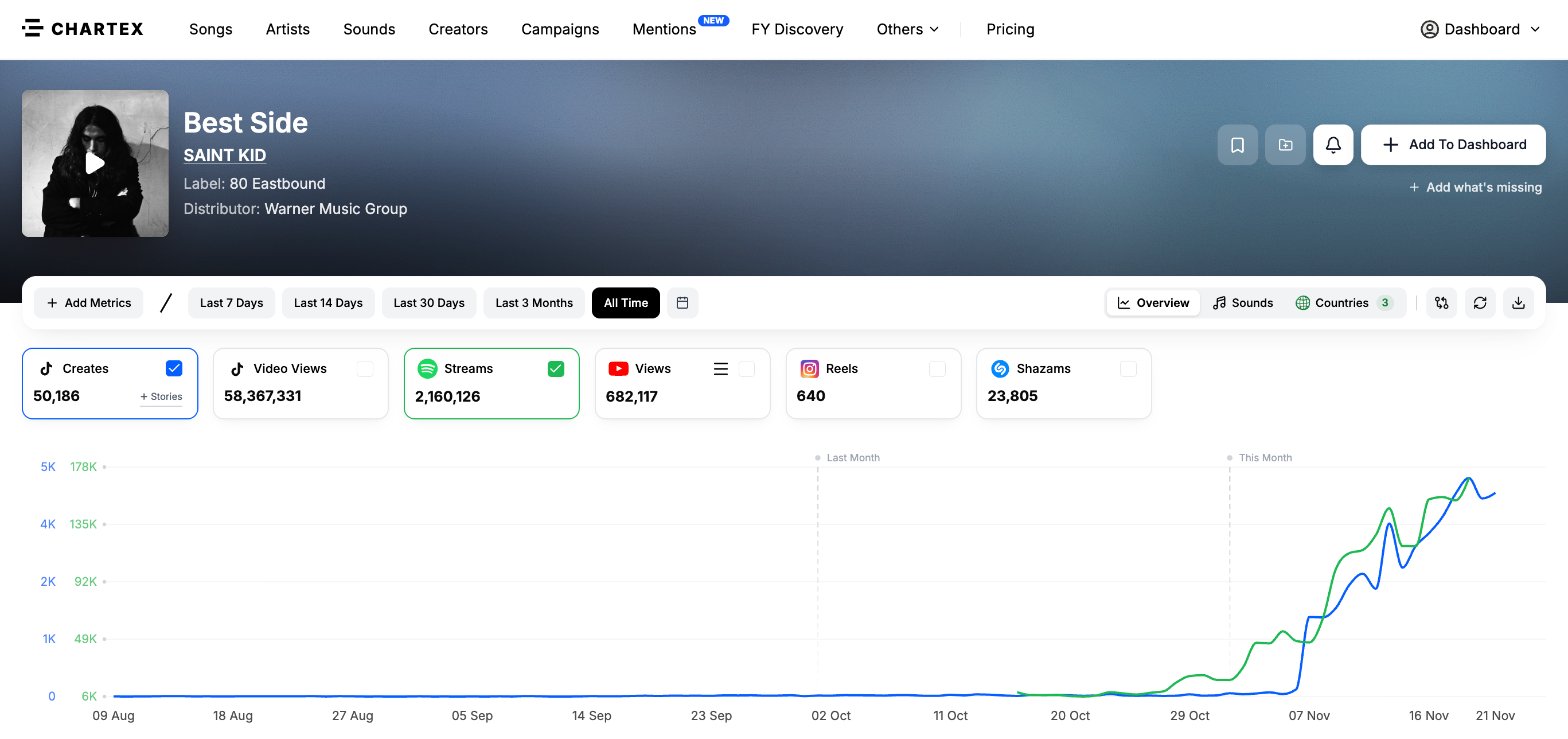
The "Best Side" song page on Chartex puts TikTok creates and Spotify streams on the same chart. Both lines stay flat through October and climb together from the end of the month.
As of November 22, 2026, Chartex counts 50,186 TikTok videos made with the song, 58.4 million views on those videos, 2,160,126 Spotify streams, 682,117 YouTube views and 23,805 Shazams.
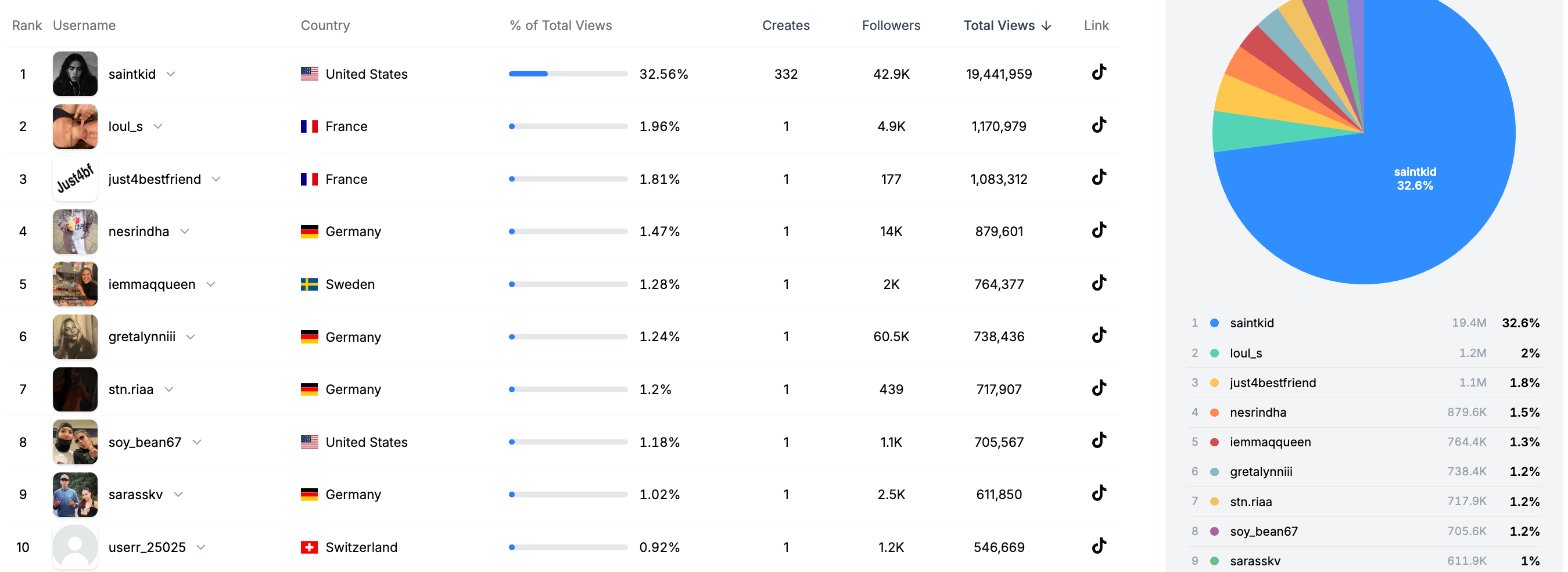
The song's Influencers table lists 3,798 TikTok creators. SAINT KID's own account is first, with 332 videos and 19.4 million views, 32.56% of all views on the song. Every other account in the top 10 made one video with it.
The two videos behind the spike
On the song page, you can drag across any period of the chart to see what happened in it. Selecting November 2 to 21 shows 46.1K new TikTok videos with the song, 1.8 million new Spotify streams, and the most viewed videos posted in those days.
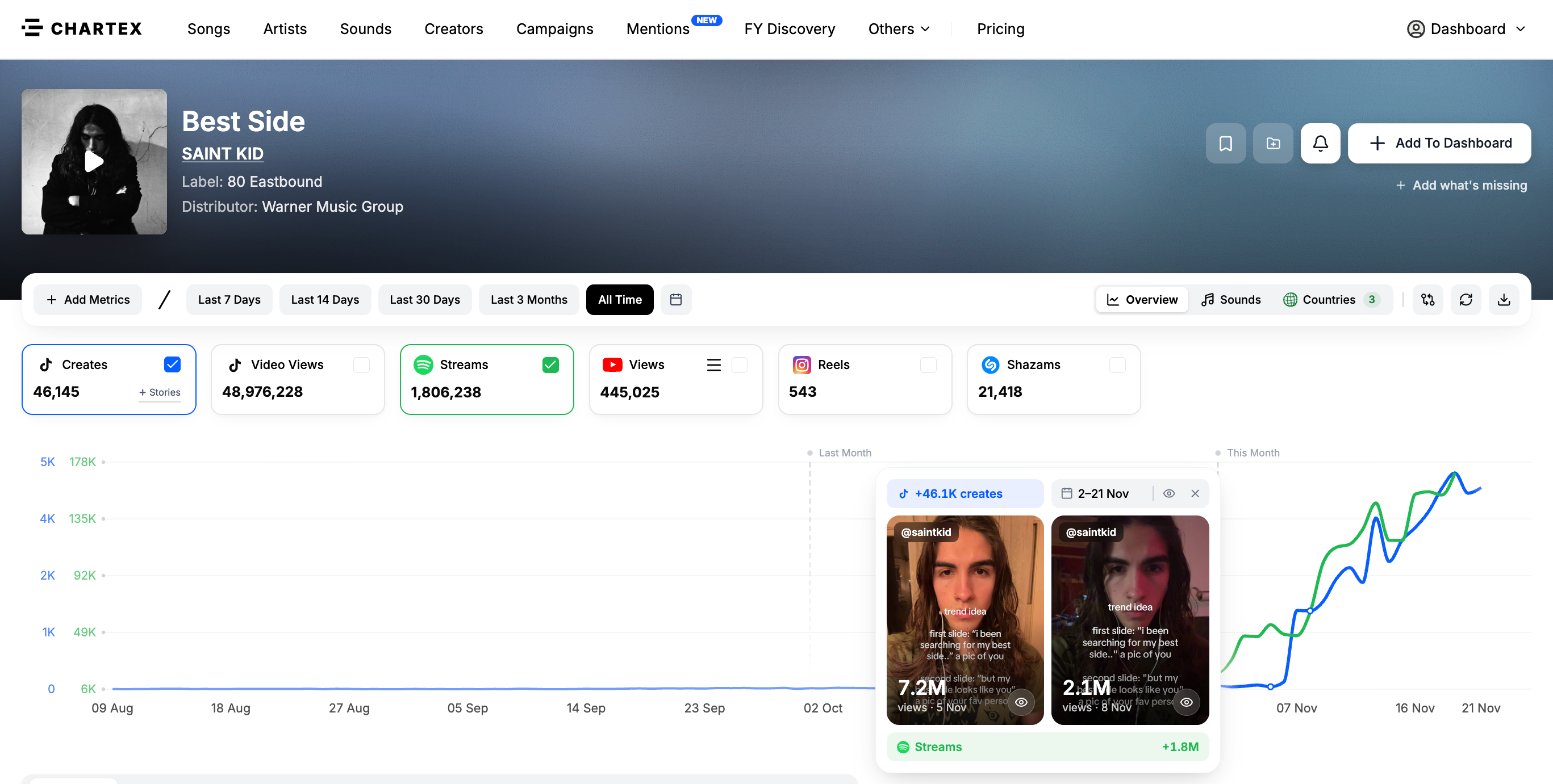
Both are SAINT KID's own posts. The first, posted on November 5, has 7.2 million views; the second, posted on November 8, has 2.1 million. Both use the same format: a two-slide post labelled "trend idea", built on the song's line about searching for a best side. The jump in creates on the chart starts in the same days.
His own profiles grew too
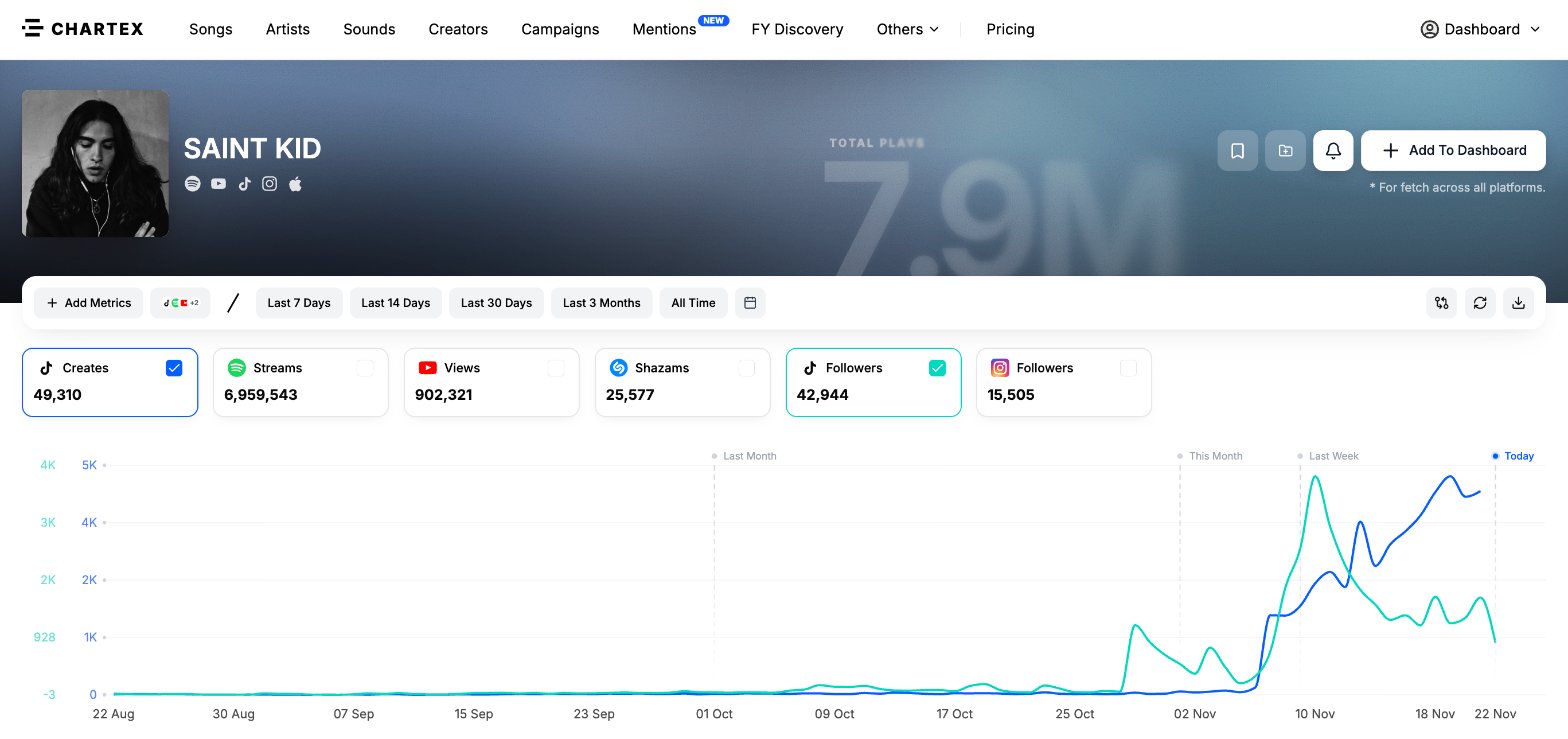
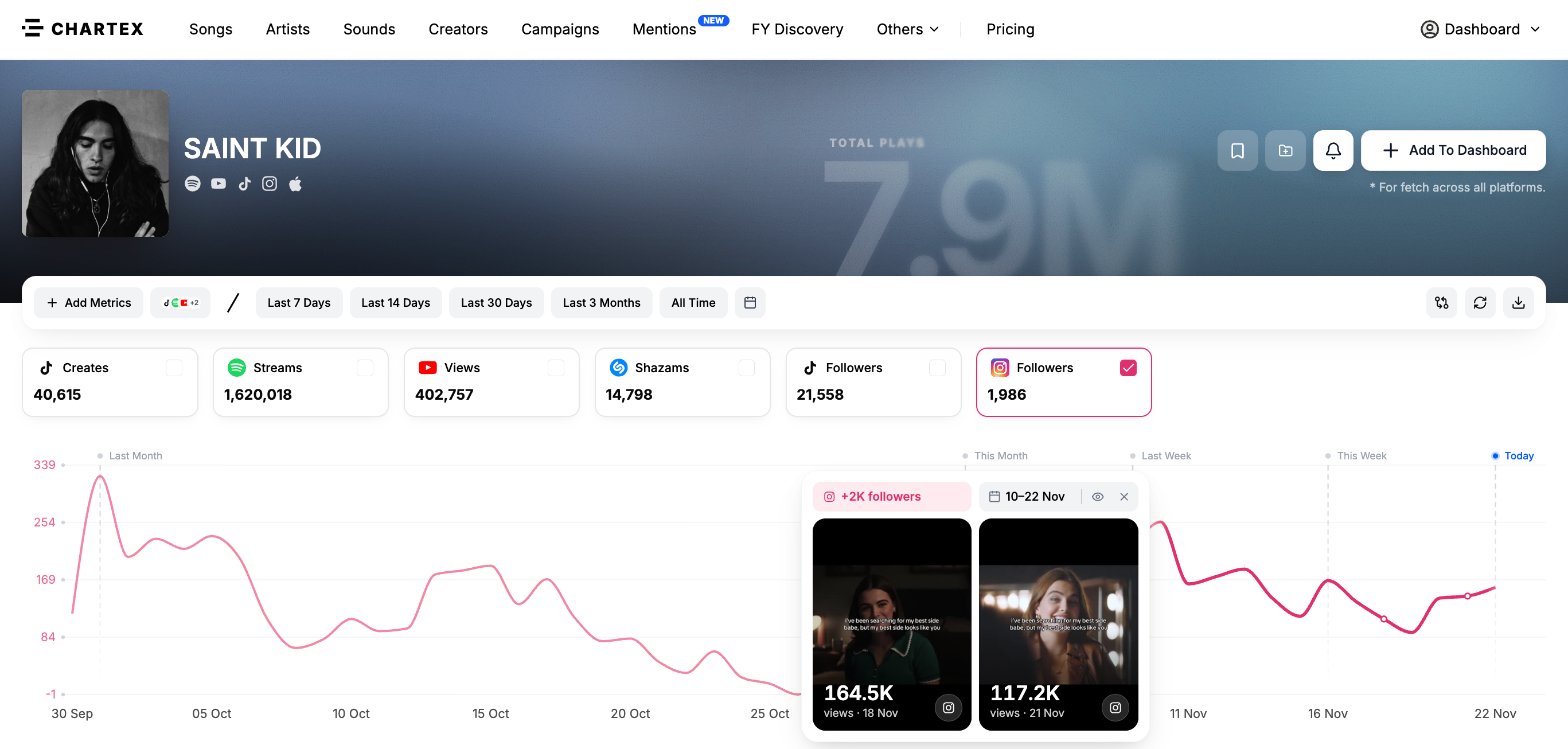
The SAINT KID artist page shows his TikTok followers next to the creates on his music. Through October he gained almost no followers a day. In November, daily gains rose to nearly 4,000. He now has 42,944 TikTok followers.
He tried the song on Instagram as well, with short clips carrying its lyric on screen. From November 10 to 22 his Instagram account gained 1,986 followers, and his two most viewed posts in that period reached 164.5K and 117.2K views.
A fan page and an unverified Charlie Puth post
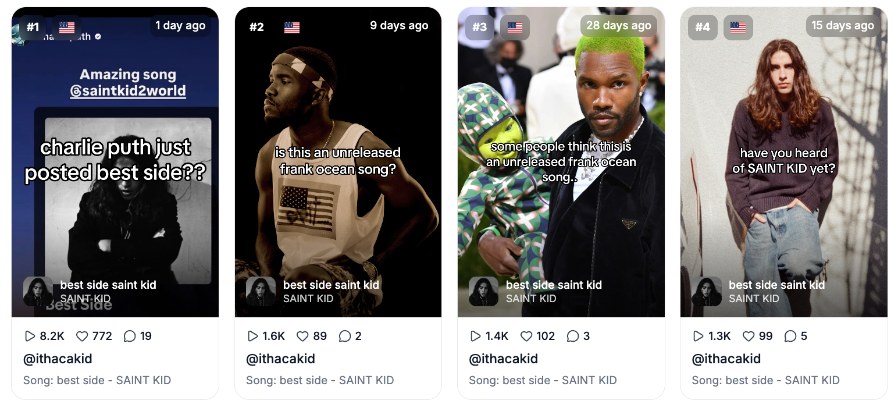
The Fan Pages tab on the artist page lists one TikTok account dedicated to SAINT KID: @ithacakid, based in the US, with 348 followers and about 9 posts a week.

Its posts lean on two hooks. Several compare SAINT KID to Frank Ocean ("is this an unreleased frank ocean song?"). Its most viewed post in the last 30 days, with 8.2K views, asks "charlie puth just posted best side??" and shows what looks like a Charlie Puth story calling it an "amazing song". We could not verify that Charlie Puth posted it.
The song enters the charts
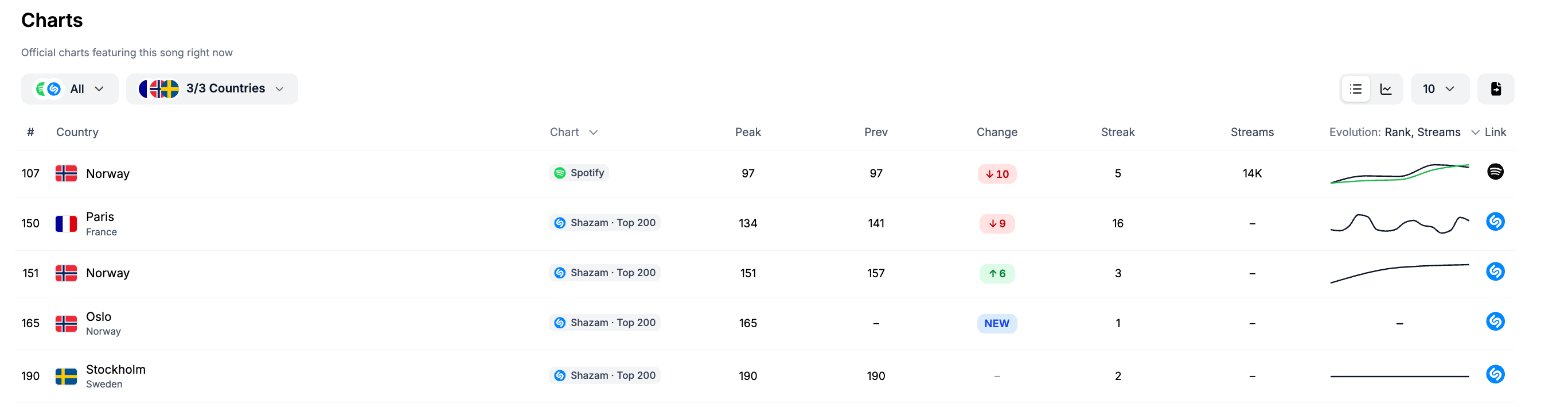
The Charts table on the song page lists the official charts the song is on right now. "Best Side" is on the Spotify chart in Norway, at 107 after a peak of 97, and on the Shazam Top 200 in Paris (peak 134), Norway (151), Oslo (165, new entry) and Stockholm (190).
His older songs grew too
The break lifted more than one song. "Love Me Still", an older SAINT KID release, never had a TikTok moment of its own: Chartex counts 106 TikTok videos with it in total. For more than a year it drew between roughly 600 and 3,000 Spotify streams a day. In November, as "Best Side" broke, it climbed to around 11,000 a day. It now has 1,018,041 Spotify streams in total.
What to take from it
Low views are not a verdict
Hundreds of posts at a few hundred views came before the week the song broke.
Release day is not the finish line
He kept posting after the release. The jump came three weeks later.
The artist's own account counts
A third of the song's TikTok views came from SAINT KID's own profile.
One format can carry the song
His two biggest videos used the same slideshow idea, one others could copy.
Check any song
Every song on Chartex has the same chart and creators table. Open Best Side or the SAINT KID artist page, or start from the artists chart.
Frequently asked questions
Who released Best Side by SAINT KID?
On Chartex, Best Side is listed under the label 80 Eastbound, with Warner Music Group as distributor.
How can I see who posts a song the most on TikTok?
Open the song on Chartex and go to the Influencers table. It lists every TikTok creator who used the song, with the number of videos each one made, their followers and their share of the song's total views.